Note
Go to the end to download the full example code.
EMPR on an 3D Tensor
Load an RGB image as a 3D tensor, run EMPR, reconstruct the tensor, and compare the reconstruction with the original image.
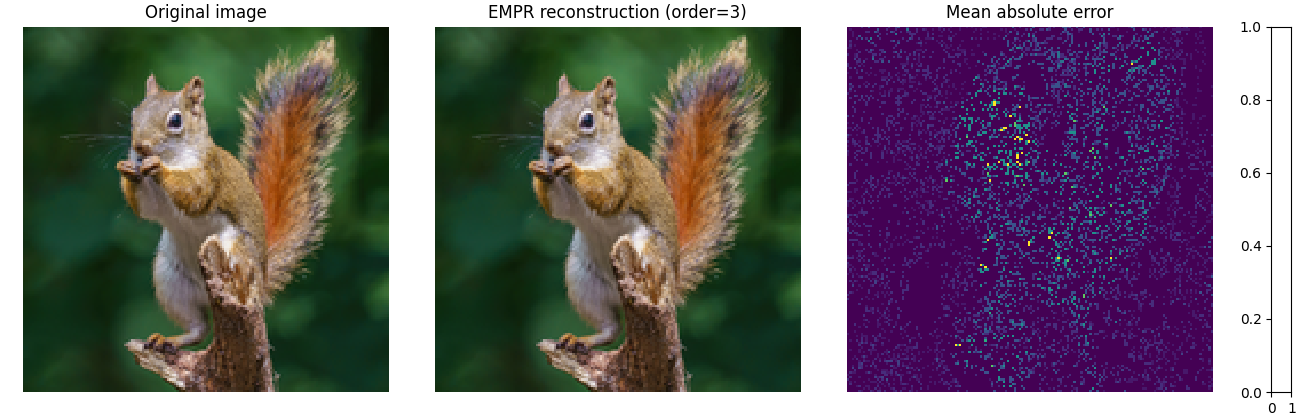
Image path: /home/runner/work/HDMRLib/HDMRLib/docs/_static/examples/squirell.png
Input shape: (160, 160, 3)
Reconstructed shape: (160, 160, 3)
Available component keys: ['g_0', 'g_1', 'g_2', 'g_3', 'g_1,2', 'g_1,3', 'g_2,3', 'g_1,2,3']
Mean absolute error: 3.2556784236118884e-18

(np.float64(-0.5), np.float64(159.5), np.float64(159.5), np.float64(-0.5))
from pathlib import Path

import matplotlib.pyplot as plt
import numpy as np
import os
from PIL import Image

from hdmrlib import EMPR


candidates = [
    Path(os.environ.get("GITHUB_WORKSPACE", "")) / "docs" / "_static" / "examples" / "squirell.png",
    Path("docs/_static/examples/squirell.png"),
    Path("_static/examples/squirell.png"),
]

image_path = None
for candidate in candidates:
    if str(candidate) and candidate.exists():
        image_path = candidate
        break

if image_path is None:
    raise FileNotFoundError(
        "Could not find squirell.png. Checked:\n"
        + "\n".join(str(p) for p in candidates)
    )

# Load image
img = Image.open(image_path).convert("RGB")
max_size = 160
img.thumbnail((max_size, max_size), Image.Resampling.LANCZOS)

X = np.asarray(img, dtype=np.float64) / 255.0

# RGB image is a 3D tensor, so use order=3
empr = EMPR(X, order=3)
X_reconstructed = np.asarray(empr.reconstruct(), dtype=np.float64)
components = empr.components()

# Clip for display
X_display = np.clip(X, 0.0, 1.0)
X_reconstructed_display = np.clip(X_reconstructed, 0.0, 1.0)

# Mean absolute error across RGB channels
error_map = np.mean(np.abs(X_display - X_reconstructed_display), axis=2)

print("Image path:", image_path)
print("Input shape:", X.shape)
print("Reconstructed shape:", X_reconstructed.shape)
print("Available component keys:", list(components.keys()))
print("Mean absolute error:", float(np.mean(error_map)))

# Create three equal-sized image axes + one separate colorbar axis.
fig = plt.figure(figsize=(13, 4.2), constrained_layout=True)
gs = fig.add_gridspec(1, 4, width_ratios=[1, 1, 1, 0.05])

ax0 = fig.add_subplot(gs[0, 0])
ax1 = fig.add_subplot(gs[0, 1])
ax2 = fig.add_subplot(gs[0, 2])
cax = fig.add_subplot(gs[0, 3])

# Use nearest to avoid display blur in docs/screenshots.
ax0.imshow(X_display, interpolation="nearest")
ax0.set_title("Original image")
ax0.axis("off")

ax1.imshow(X_reconstructed_display, interpolation="nearest")
ax1.set_title("EMPR reconstruction (order=3)")
ax1.axis("off")

im = ax2.imshow(error_map, cmap="viridis", interpolation="nearest")
ax2.set_title("Mean absolute error")
ax2.axis("off")
Total running time of the script: (0 minutes 0.437 seconds)