Note
Go to the end to download the full example code.
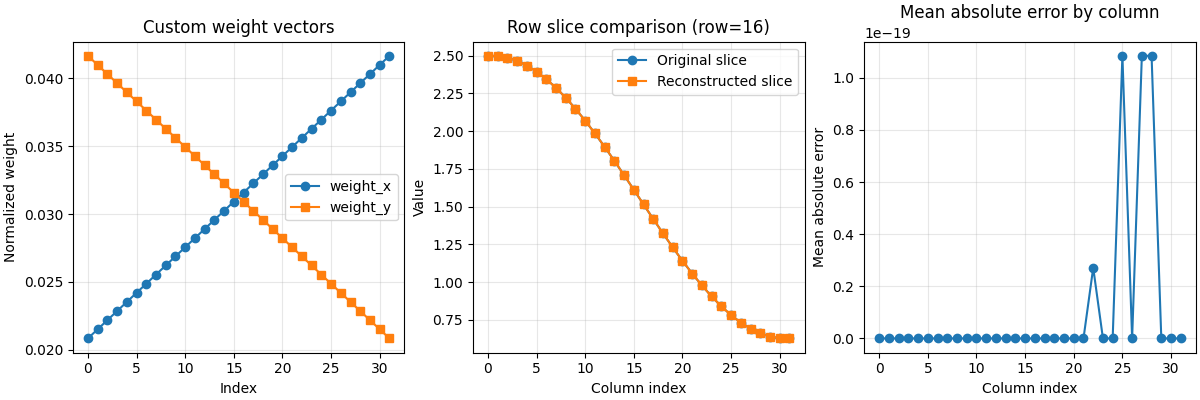
HDMR with Custom Weights
Run HDMR with user-defined weight vectors and inspect how the chosen weights affect the reconstruction.
Weight shapes: (32, 1) (32, 1)
Available component keys: ['g_0', 'g_1', 'g_2', 'g_1,2']
Mean absolute error: 1.1011428314305904e-20
import matplotlib.pyplot as plt
import numpy as np

from hdmrlib import HDMR


x = np.linspace(0.0, 1.0, 32)
y = np.linspace(0.0, 1.0, 32)

X = (
    0.5
    + np.sin(np.pi * x)[:, None]
    + np.cos(np.pi * y)[None, :]
    + 0.25 * np.outer(x, y)
)

weight_x = np.linspace(1.0, 2.0, 32).reshape(-1, 1)
weight_y = np.linspace(2.0, 1.0, 32).reshape(-1, 1)

weight_x = weight_x / weight_x.sum()
weight_y = weight_y / weight_y.sum()

hdmr = HDMR(
    X,
    order=2,
    weight="custom",
    custom_weights=[weight_x, weight_y],
    supports="ones",
)

X_reconstructed = np.asarray(hdmr.reconstruct(), dtype=np.float64)
abs_error = np.abs(X - X_reconstructed)

mae_by_col = np.mean(abs_error, axis=0)
mae_total = float(np.mean(abs_error))

mid_row = X.shape[0] // 2

print("Weight shapes:", weight_x.shape, weight_y.shape)
print("Available component keys:", list(hdmr.components().keys()))
print("Mean absolute error:", mae_total)

fig, axes = plt.subplots(1, 3, figsize=(12, 4), constrained_layout=True)

# Panel 1: custom weights
axes[0].plot(np.arange(weight_x.shape[0]), weight_x[:, 0], marker="o", label="weight_x")
axes[0].plot(np.arange(weight_y.shape[0]), weight_y[:, 0], marker="s", label="weight_y")
axes[0].set_title("Custom weight vectors")
axes[0].set_xlabel("Index")
axes[0].set_ylabel("Normalized weight")
axes[0].grid(True, alpha=0.3)
axes[0].legend()

# Panel 2: one representative slice
axes[1].plot(X[mid_row, :], marker="o", label="Original slice")
axes[1].plot(X_reconstructed[mid_row, :], marker="s", label="Reconstructed slice")
axes[1].set_title(f"Row slice comparison (row={mid_row})")
axes[1].set_xlabel("Column index")
axes[1].set_ylabel("Value")
axes[1].grid(True, alpha=0.3)
axes[1].legend()

# Panel 3: error summary
axes[2].plot(mae_by_col, marker="o")
axes[2].set_title("Mean absolute error by column")
axes[2].set_xlabel("Column index")
axes[2].set_ylabel("Mean absolute error")
axes[2].grid(True, alpha=0.3)

plt.show()
Total running time of the script: (0 minutes 0.304 seconds)