Note
Go to the end to download the full example code.
Inspect Component Terms
Inspect the available component keys and visualize the magnitude of each component term.
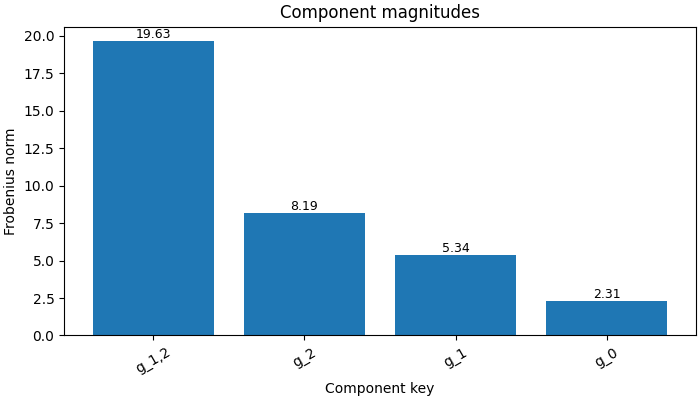
Available component keys: ['g_0', 'g_1', 'g_2', 'g_1,2']
import matplotlib.pyplot as plt
import numpy as np

from hdmrlib import EMPR


x = np.linspace(0.0, 1.0, 32)
y = np.linspace(0.0, 1.0, 32)

X = (
    0.5
    + np.sin(np.pi * x)[:, None]
    + np.cos(np.pi * y)[None, :]
    + 0.25 * np.outer(x, y)
)

empr = EMPR(X, order=2)
components = empr.components()

keys = list(components.keys())
norms = [float(np.linalg.norm(np.asarray(components[key]))) for key in keys]

# Sort terms by magnitude for a clearer comparison.
pairs = sorted(zip(keys, norms), key=lambda t: t[1], reverse=True)
sorted_keys = [str(k) for k, _ in pairs]
sorted_norms = [v for _, v in pairs]

print("Available component keys:", keys)

fig, ax = plt.subplots(figsize=(7, 4), constrained_layout=True)
bars = ax.bar(sorted_keys, sorted_norms)

ax.set_title("Component magnitudes")
ax.set_xlabel("Component key")
ax.set_ylabel("Frobenius norm")
ax.tick_params(axis="x", rotation=30)

for bar, value in zip(bars, sorted_norms):
    ax.text(
        bar.get_x() + bar.get_width() / 2,
        bar.get_height(),
        f"{value:.2f}",
        ha="center",
        va="bottom",
        fontsize=9,
    )

plt.show()
Total running time of the script: (0 minutes 0.098 seconds)