Note
Go to the end to download the full example code.
Lower-Order Reconstruction
Compare full and lower-order reconstructions and relate the approximation quality to the retained component terms.
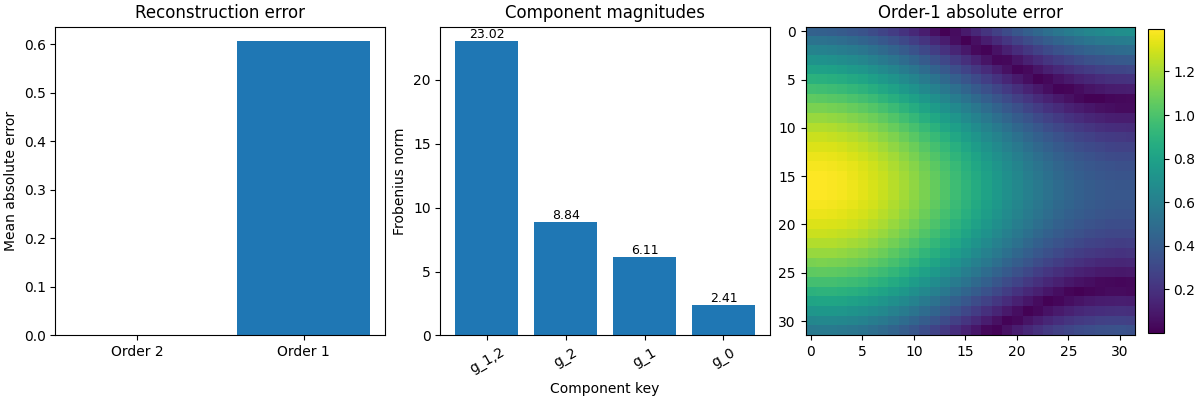
Available component keys: ['g_0', 'g_1', 'g_2', 'g_1,2']
Full reconstruction MAE: 8.250100906256885e-19
Order-1 reconstruction MAE: 0.6063038502324416
import matplotlib.pyplot as plt
import numpy as np

from hdmrlib import EMPR


x = np.linspace(0.0, 1.0, 32)
y = np.linspace(0.0, 1.0, 32)

X = (
    0.5
    + np.sin(np.pi * x)[:, None]
    + np.cos(np.pi * y)[None, :]
    + 0.35 * np.outer(x, y)
)

empr = EMPR(X, order=2)
components = empr.components()

X_full = np.asarray(empr.reconstruct(order=2), dtype=np.float64)
X_order1 = np.asarray(empr.reconstruct(order=1), dtype=np.float64)

full_mae = float(np.mean(np.abs(X - X_full)))
order1_mae = float(np.mean(np.abs(X - X_order1)))

keys = list(components.keys())
norms = [float(np.linalg.norm(np.asarray(components[key]))) for key in keys]

pairs = sorted(zip(keys, norms), key=lambda t: t[1], reverse=True)
sorted_keys = [str(k) for k, _ in pairs]
sorted_norms = [v for _, v in pairs]

print("Available component keys:", keys)
print("Full reconstruction MAE:", full_mae)
print("Order-1 reconstruction MAE:", order1_mae)

fig, axes = plt.subplots(1, 3, figsize=(12, 4), constrained_layout=True)

# Panel 1: reconstruction error comparison
axes[0].bar(
    ["Order 2", "Order 1"],
    [full_mae, order1_mae],
)
axes[0].set_title("Reconstruction error")
axes[0].set_ylabel("Mean absolute error")

# Panel 2: retained component magnitudes
bars = axes[1].bar(sorted_keys, sorted_norms)
axes[1].set_title("Component magnitudes")
axes[1].set_xlabel("Component key")
axes[1].set_ylabel("Frobenius norm")
axes[1].tick_params(axis="x", rotation=30)

for bar, value in zip(bars, sorted_norms):
    axes[1].text(
        bar.get_x() + bar.get_width() / 2,
        bar.get_height(),
        f"{value:.2f}",
        ha="center",
        va="bottom",
        fontsize=9,
    )

# Panel 3: spatial error for lower-order reconstruction
order1_error = np.abs(X - X_order1)
im = axes[2].imshow(order1_error, aspect="auto", interpolation="nearest")
axes[2].set_title("Order-1 absolute error")
fig.colorbar(im, ax=axes[2], fraction=0.046, pad=0.04)

plt.show()
Total running time of the script: (0 minutes 0.295 seconds)